Infographic: Email Subject Line & Open Rate Statistics 2020
A lot has changed in this momentous year of 2020, and so has the evolution of email. While many other forms of communication, such as chatbots with conversational marketing, and platforms such as TikTok, Reels, and more are all fighting for eyeball attention, one thing remains true - email is still one of the most effective methods of communication still to this day.

Email marketing is still very much a craft. There are good ways to use it and there are bad, very bad ways to use it. As email marketers work hard at optimising their efforts through AB Testing, automation, design, and more, it's good to take a step back once in a while to reflect on what is working at an aggregate level across the industry.
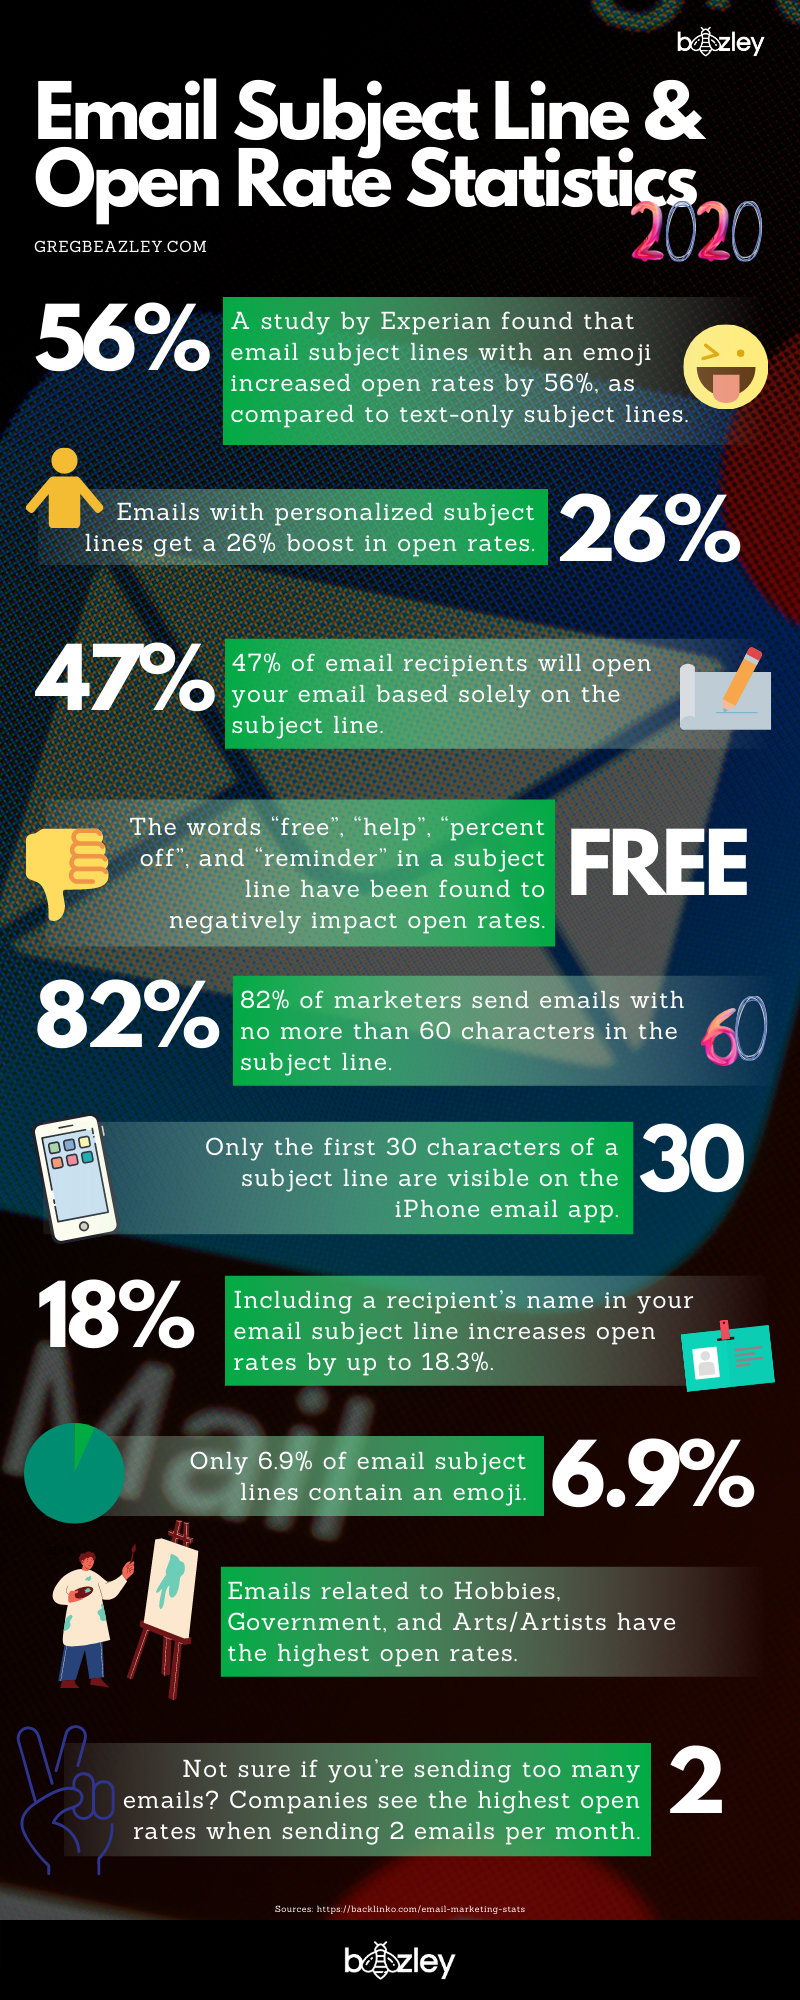
Below is an infographic and visual snapshot of 10 Email Subject Line & Open Rate Statistics in 2020.
10 Email Subject Line & Open Rate Statistics in 2020

Source: https://backlinko.com/email-marketing-stats
A Breakdown Of Email Subject Line & Open Rate Statistics in 2020
- A study by Experian found that email subject lines with an emoji increased open rates by 56%, as compared to text-only subject lines. (Source)
- Emails with personalized subject lines get a 26% boost in open rates. (Source)
- 47% of email recipients will open your email based solely on the subject line. (Source)
- 82% of marketers send emails with no more than 60 characters in the subject line. (Source)
- Only the first 30 characters of a subject line are visible on the iPhone email app. (Source)
- The words “free”, “help”, “percent off”, and “reminder” in a subject line have been found to negatively impact open rates. (Source)
- Only 6.9% of email subject lines contain an emoji. (Source)
- Emails related to Hobbies, Government, and Arts/Artists have the highest open rates. (Source)
- 64% of email recipients say they would open an email based on if they trusted the brand. (Source)
- Not sure if you’re sending too many emails? Companies see the highest open rates when sending 2 emails per month. (Source)
How was the infographic designed?
I used Canva to design this infographic. It took approximately 45 minutes to create from scratch without using a pre-built template. I sourced the background image from Unsplash.com and the icons were all free from within Canva.
If you would like to know another way of how to create infographics like this, check out my other post How To Create Simple & Effective Infographics - A Step By Step Guide.
